New Method Uncovers Hidden Population Spikes at Some ICE Detention Centers
A new method for analyzing ICE data reveals recent spikes in the number of people held in ICE facilities like Stewart and Moshannon, trends normally obscured by ICE’s year-to-date reporting averages.
The number of immigrants detained at Stewart Detention Center in Georgia and Moshannon Valley Processing Center in Pennsylvania have spiked in recent weeks—but you wouldn’t know it based on ICE’s public detention data. Here’s why.
ICE only reports average daily population (ADP) for each facility since the start of the fiscal year in October—not the number of people currently detained. This method of reporting the data has a “smoothing” effect, which means that significant changes to the detained population at individual facilities tends to register slowly over the course of the year. This methodology has been has been used for years and does not reflect any recent changes to ICE reporting under the current administration.
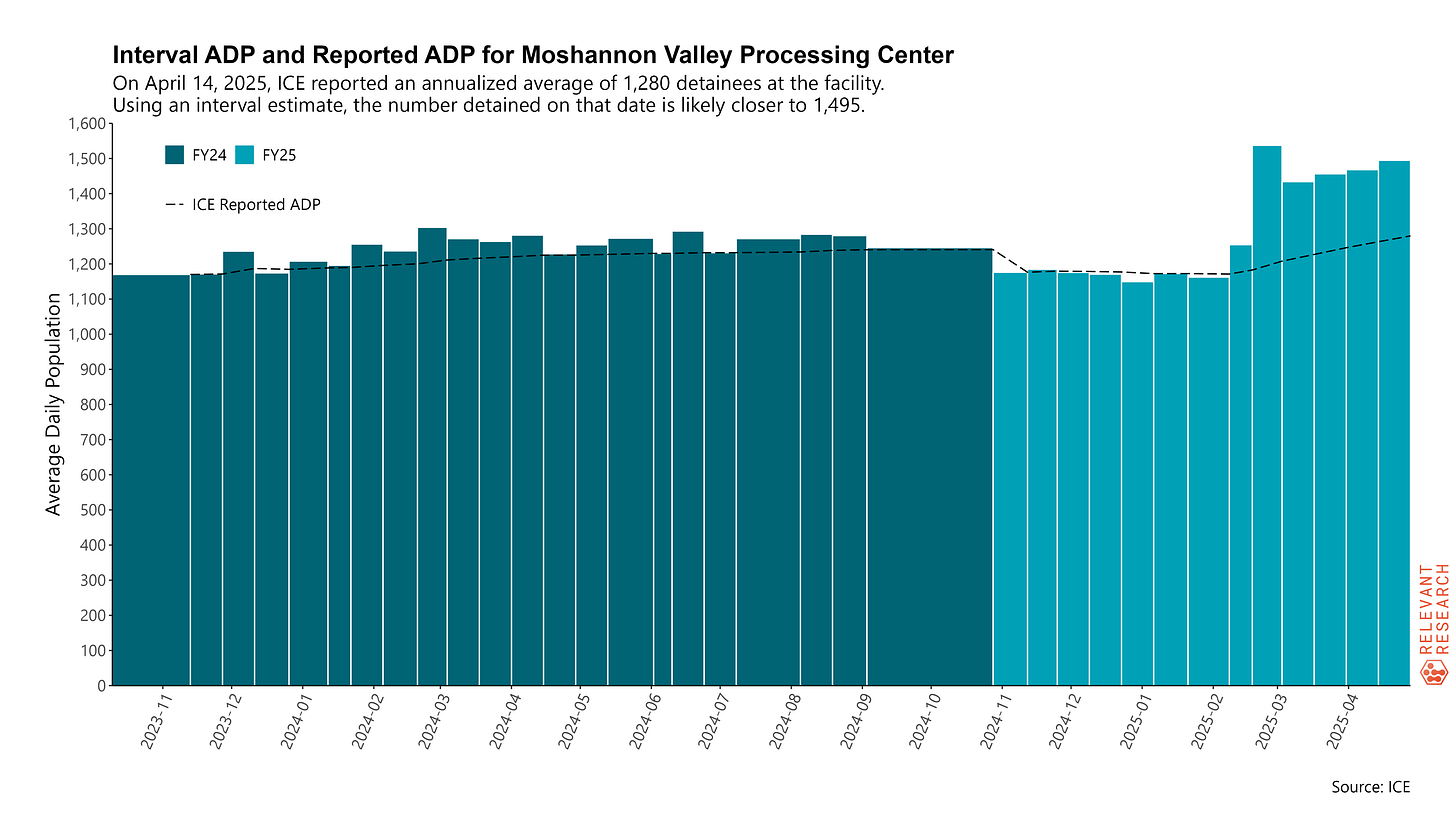
Using a new methodology published through our work at Relevant Research, we can estimate recent detention numbers at any detention facility. We do this by comparing changes in ICE’s ADP numbers between two reporting dates and estimating the average daily population for only that specific period—typically over two weeks.
We refer to our estimate as Interval ADP and we refer to ICE’s facility-level data as Reported ADP. By comparing Interval ADP and Reported ADP, we are then able to identify facilities where recent population numbers vary from the fiscal-year-to-date average. Sometimes the differences are negligible, and sometimes they are quite stark.
Take Stewart Detention Center in rural Georgia, for example—one of the largest detention centers in the country. As ICE’s total detention population grew from around 30,000 to nearly 50,000 since January, Stewart Detention Center’s detained population also grew. But just how much it grew has been somewhat obscured by how ICE represents the data.
ICE’s Reported ADP—the average daily population since October 1, 2024—is 1,717. But by comparing ICE’s two most recent facility-level data reports, current on March 31 and April 14, we find that the Interval ADP for this 14-day period was 2,182. This is 465 more people per day on average than reported, or about 27 percent higher than reported. The figure below visualizes this finding and includes an historical interval-by-interval analysis going back to the start of fiscal year 2023. The different widths of the bars reflect shorter or longer periods between current data, with longer delays on reporting typically taking place around the beginning of each fiscal year.
Moshannon Valley Processing Center in rural Pennsylvania provides another similar case study. ICE’s Reported ADP for FY 2025 is 1,280. However, we find that the Interval ADP for this period was 1,500. This is 220 more people per day on average than reported, or about 17 percent higher than reported. See the figure below.
The facility labelled Torrance/Estancia in New Mexico provides among the sharpest contrasts although it is not among the top twelve largest facilities. ICE’s most recent Reported ADP is 400, while our method finds that recent Interval ADP was around 679—about 70 percent higher than reported.
Sometimes Interval ADP is actually lower than Reported ADP. Otay Mesa Detention Center’s Reported ADP is actually slightly higher than recent reality. ICE’s most recent Reported ADP here is 1352, while our method finds that recent Interval ADP was around 1,300—about four percent lower than reported.
The twelve largest ICE detention facilities by average daily population right now are presented below. All data has been updated through ICE’s most recent data, which the agency released on May 9, 2025 and reflect data current on April 14, 2025.
This method is not perfect. This approach still does not answer the question of how many people are being held in individual detention facilities on any given day. We have not compared our estimates to maximum capacity at each facility to evaluate whether “overcrowding” is occurring. Our full methods paper discusses other caveats and considerations for anyone attempting to reproduce this analysis.
Nevertheless, this relatively simple calculation will be useful to many researchers, reporters, and members of the public—regardless of political perspective—who are interested in understanding the effects of heightened immigration enforcement on the detention system.
To see the full description of this methodology, download the white paper below or on Relevant Research’s website. We welcome further contributions and discussion about this approach.
For More Information
To learn more about how to make sense of immigrant detention, check out the following related posts:
Immigration Data Literacy Skills to Help You Survive a New Wave of ICE Confusion
Will Trump’s Immigration Enforcement Policies Target Dangerous Criminals? - A Close Look at the Data
Immigrant Detention in Focus: The Unconventional Photography of Greg Constantine
Support Public Scholarship
This newsletter is only possible because of your support. If you believe in keeping this work free and open to the public, consider becoming a paid subscriber. You can read more about the mission and focus of this newsletter and learn why, after three years, I finally decided to offer a paid option. If you already support this newsletter financially, thank you.


Shared on LinkedIn
Really important data. And easy to follow explanation of method and when data was released. Thank you.